
QR Code Analytics: What Your Scan Data Really Reveals
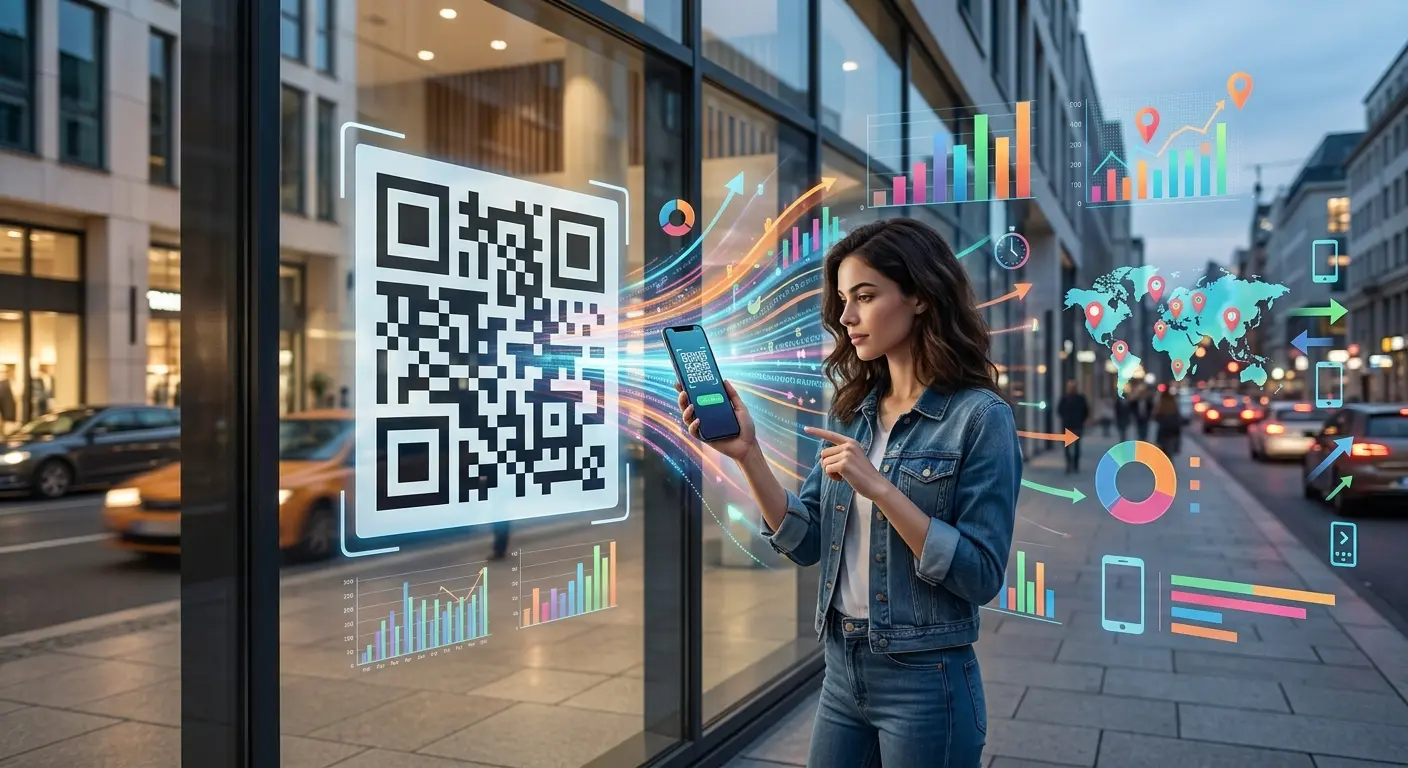
A QR code on a poster, menu, or package usually serves only as a link: scan, go to the site, done. In reality, however, a dynamic QR code hides a data source that many companies fail to utilize: Every scan provides information about when, how often, and under what circumstances a code is used.
Why a Static Code Wastes This Opportunity
A static QR code redirects users directly to the destination without passing through a server. While it works reliably, it provides no feedback on whether or how often it has been scanned. A dynamic QR code, on the other hand, uses a short URL that is logged with every scan before the user is redirected to the actual destination. It is precisely this intermediate step that makes analysis possible in the first place.
Key Metrics at a Glance
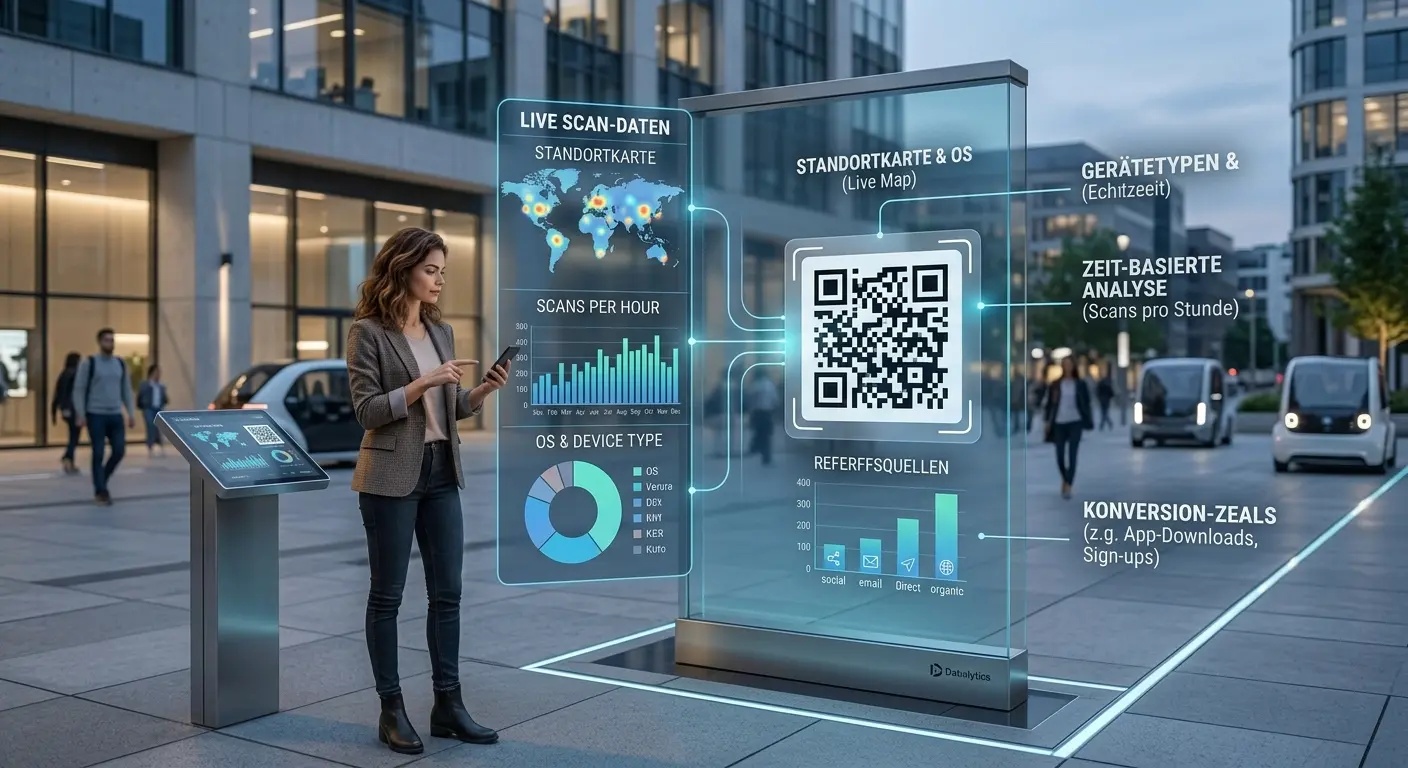
- Total number of scans: The most basic metric—how often has the code been used since it was created? It shows whether a code is even being noticed.
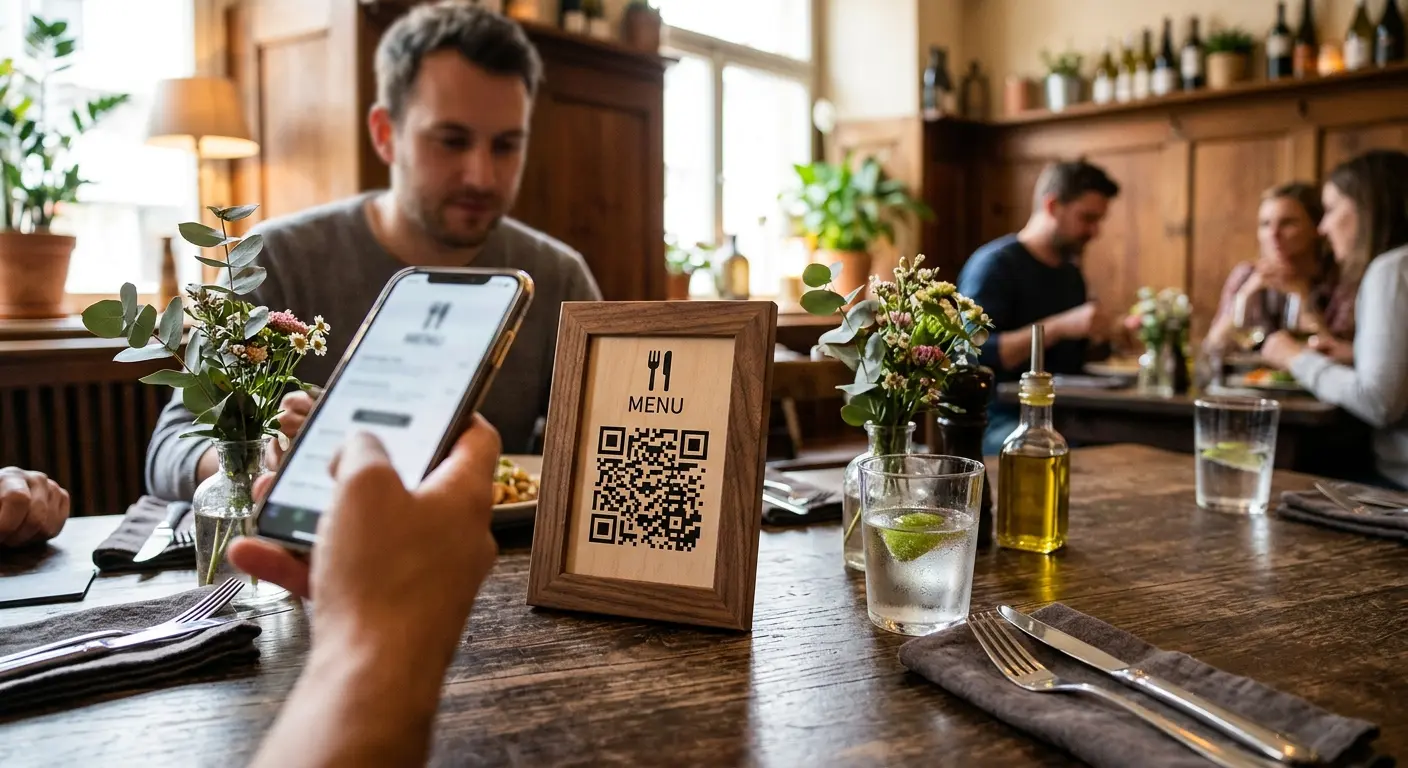
- Scans over time: Often, the trend is more interesting than the sheer total—are there specific days or times with a particularly high number of scans? For example, a QR code on a restaurant menu typically shows significant spikes during lunch and dinner hours.
- Recent Scans: A look at the most recent scan events reveals whether a newly launched campaign (new poster, new packaging) is already having an impact.
- Location-Based Analysis: If you advertise at several locations at once—such as in different stores or on various advertising spaces—use a separate code for each location to see which one actually encourages scanning. Depending on your plan, the statistics also show the country and city of the scans.
What this data makes possible in practice
Campaign performance tracking: If each advertising material gets its own QR code—all with the same destination—comparing the scan counts immediately reveals which advertising material is actually effective. This allows for a much more informed budget decision than one based solely on gut feeling.
Optimal staffing planning: If the analysis of a QR code on the menu shows a clear spike during lunchtime, this indicates when additional support at the counter or in the dining area is needed.
Reach assessment for outdoor advertising: A poster on a heavily trafficked street promises high visibility—but only the scan analysis reveals whether it actually leads to interactions. If the numbers remain low despite high foot traffic, this suggests a problem with size, placement, or incentive rather than a lack of interest.
A/B testing: Two differently designed codes or two different placements can be tested in parallel. The code with the significantly higher scan counts shows which variant works better in practice.
A common mistake: Viewing numbers without context
A metric on its own says little if it lacks a point of comparison. 200 scans in a week can be excellent or disappointing—depending on how many people actually saw the code. If you have a rough idea of a display’s reach (for example, a store’s daily customer traffic), you can convert the scan count into a meaningful scan rate.
It’s only this context that truly reveals the value of a metric.
Don’t forget about data protection
Scan statistics are valuable, but they must not come at the expense of the privacy of the people scanning the codes. Reputable QR code tools analyze location and device information anonymously, without making individual people identifiable—among other things, by truncating or anonymizing IP addresses before storage. This is entirely sufficient for meaningful, aggregated analyses without allowing conclusions to be drawn about individual people.
Start Using Your Own Data Now
With a free QRown account, you can see in the dashboard the scan statistics for all your dynamic QR codes at a glance—serving as a basis for more informed decisions rather than mere guesswork.
Put this article into practice with QRown:
A/B test